
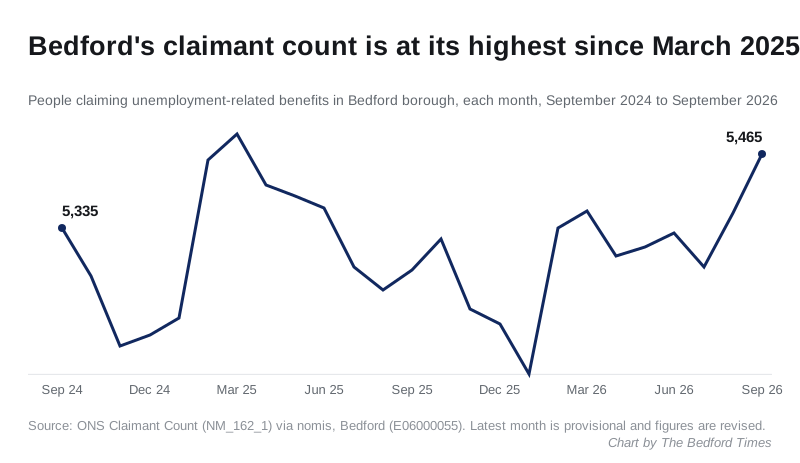
5,465 people in Bedford borough claimed jobless benefits in September, up 205 in a year. Over-50s and 18 to 24s drove the rise; 25 to 49s fell slightly.
5,465 people in Bedford borough were claiming unemployment-related benefits in September. That is the highest monthly count since March 2025. It is up 105 on August and up 205 on September last year. The last time it was higher was March 2025, at 5,500, and it fell as low as 5,075 in January this year.
The figures are the latest ONS Claimant Count for Bedford on nomis. They equal 4.5% of residents aged 16 to 64, against 4.1% for England and 3.3% for the East of England.
The rise is not evenly spread. Almost all of it comes from two age groups.
Who is claiming
Comparing September 2026 with September 2025:
| Age group | Sep 2025 | Sep 2026 | Change |
|---|---|---|---|
| 18 to 24 | 875 | 960 | up 85 (9.7%) |
| 25 to 49 | 3,150 | 3,115 | down 35 (1.1%) |
| 50 and over | 1,225 | 1,370 | up 145 (11.8%) |
| All ages | 5,260 | 5,465 | up 205 (3.9%) |
- The over-50s added the most claimants. Within that group, the 60 to 64 band rose from 305 to 385, up 26%.
- Young adults are still rising. Two years ago, in September 2024, 740 people aged 18 to 24 were claiming. That is now 960, up 30%.
- The 25 to 49 group, the largest, is slightly down. It was 3,315 in September 2024.
We first reported the rise among under-25s in August, in our look at the claimant count by age. The pattern has held since, and the over-50s have now joined it.
How Bedford compares
The count rose across England in September, so part of Bedford’s monthly jump is national. England’s total went up 2.4% in the month; Bedford’s went up 2.0%.
Over the year, though, Bedford has risen faster than most of its neighbours:
| Area | Sep 2025 | Sep 2026 | Change in a year | Share of 16 to 64s |
|---|---|---|---|---|
| Bedford | 5,260 | 5,465 | up 3.9% | 4.5% |
| Central Bedfordshire | 5,005 | 5,150 | up 2.9% | 2.6% |
| Milton Keynes | 8,055 | 8,140 | up 1.1% | 4.1% |
| Luton | 10,595 | 10,320 | down 2.6% | 6.6% |
| East of England | 127,205 | 132,405 | up 4.1% | 3.3% |
| England | 1,456,065 | 1,493,875 | up 2.6% | 4.1% |
Luton still has the highest rate around here by some way. But it is the only council in the table where the count has fallen over the year.
What the figure does and does not measure
The claimant count is people claiming Jobseeker’s Allowance, or Universal Credit with a requirement to look for work. It is not the unemployment rate. It includes some people who are in work but earn too little, and it misses unemployed people who do not claim.
The latest month is provisional, and these figures are revised. The July 2026 count we reported in August, 5,345, now reads 5,265 on nomis. September’s 5,465 could move too.
What it means for you
- If you have lost work or had your hours cut, the Jobcentre Plus finder on GOV.UK gives the office and phone line for Bedford, and Universal Credit can be claimed online.
- If you are struggling with bills, Bedford Borough Council’s own help with council tax is set out on our Bedford council tax bands page, including Council Tax Support.
The next monthly figures, for October, are due from the ONS in November. We will report them if the picture changes.
Sources
- ONS Claimant Count, Bedford, by age, on nomis (dataset NM_162_1, Bedford E06000055, September 2024 to September 2026)
- The same dataset for Central Bedfordshire, Milton Keynes, Luton, the East of England and England, September 2025 and September 2026
Have your say