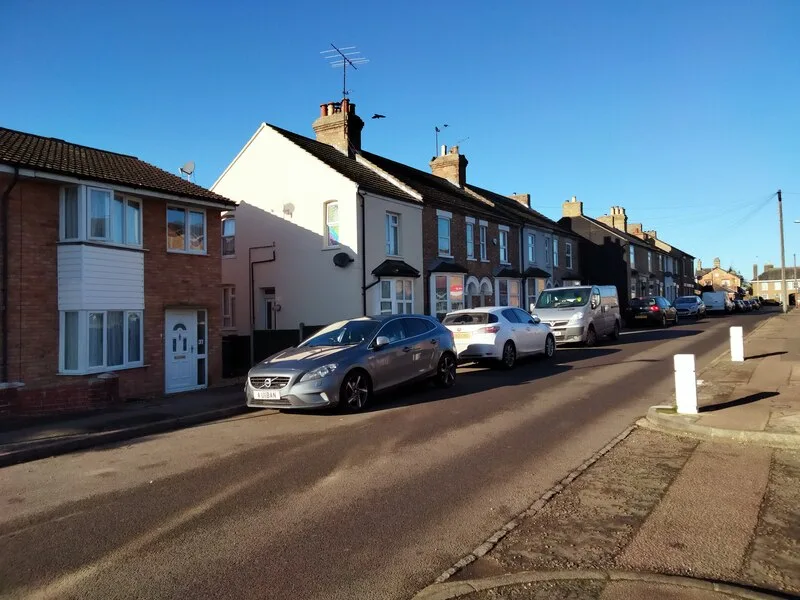

Bedford homes average £329,830 and rose 4.4% in a year while England managed 1.8%. May 2026 was the record month. Median sold prices for every borough postcode.
Asking prices tell you what sellers want. What matters is what homes actually change hands for, and every completed sale in England and Wales is registered with HM Land Registry and published. This page reads that record for Bedford borough: the official average, how fast it is moving, and what the middle home sold for in the town centre, in Kempston, in Brickhill and Putnoe, and out in the villages.
Two things to fix before the numbers. First, the official index covers the whole borough, which runs from the Northamptonshire boundary at Podington down to Wixams and out east to the A1 at Wyboston. A single borough average flattens all of that. Second, Bedford is not a flat market: flats and maisonettes were only 12.8% of everything sold here in the last year, against 31.9% semi-detached houses. Where flats do dominate, which is the town centre, the numbers look nothing like the rest of the borough.
The headline figure
The average Bedford home sold for £329,830 in June 2026, the most recent month published in the UK House Price Index. That is up 4.4% over the year.
The record month is the one before it. May 2026 came in at £334,156, the highest figure the index has recorded for Bedford since the series began in 1995, and June gave £4,326 of that back in a single month. We covered that month in Bedford house prices up £13,849, fastest of its neighbours.
The rate of increase is the part worth pausing on. Over the same twelve months England rose 1.8% to £293,262 and the East of England rose 1.1% to £338,707. Bedford grew at nearly two and a half times the national rate, and faster than any of the four councils that border the borough.
This is a recent turn. Two years ago the same index had Bedford at £304,154 and falling 1.6% a year. The line crossed back into growth in late 2024, reached 4.6% by December 2025 and 4.4% by June 2026. The index does not explain why, and we are not going to pretend it does. What is on the public record is that in the same window the Government made a special development order for Universal’s theme park at Kempston Hardwick and East West Rail moved towards a consent application. Any estate agent in town will tell you those two things are in the price. The index simply shows the price.
What it means for you
If you are buying, you are buying into a rising market rather than a flat one, and the rise is broad. Terraces are up 5.4% over the year, semi-detached houses 5.3% and detached houses 3.6%. Only flats have lagged, at 2.0%. There is no soft corner of this market to wait for except, arguably, the flats.
If you are selling, the numbers are on your side for the first time since 2022, and unusually the middle of the market is moving faster than the top.
If you are a first-time buyer, the average first-time-buyer purchase in Bedford was £271,873 in June 2026, up 4.8% in a year. That is £26,423 more than the average price of any home in England. On the other hand a Bedford flat still averages £159,325, which is cheaper than the England-wide flat average of £219,154, and that gap is the borough’s real entry point.
Prices by property type
Borough averages for June 2026 from the UK House Price Index:
- Detached houses: £560,990. Up 3.6% over the year. Concentrated in the north-east villages, Bromham and the Kimbolton Road end of Putnoe.
- Semi-detached houses: £346,527. Up 5.3%, and the borough’s most common sale.
- Terraced houses: £275,742. Up 5.4%, the fastest-rising type. The usual way into a house rather than a flat in Kempston and Queens Park.
- Flats and maisonettes: £159,325. Up 2.0%, and by a distance the cheapest flat market of any authority in this part of the East of England. It is still £3,568 below its November 2022 peak of £162,893, the only type in the borough that has not recovered.
What each part of the borough actually sells for
This is where the borough average stops being useful.
The table below is our own analysis of 2,038 residential sales recorded in the Bedford district that completed between 1 July 2025 and 30 June 2026, taken from HM Land Registry Price Paid data. It shows the median, the middle sale, which one very large transaction cannot distort. The borough median over that period was £335,000; the mean over the same sales was £373,526, and the £38,526 gap between those two numbers is why we use the median.
Two notes on the geography. Only sales the Land Registry files under the Bedford district are counted, so the parts of MK43, MK44 and MK45 that fall into Central Bedfordshire, Milton Keynes or Huntingdonshire are excluded, and so are Biggleswade and Sandy, which are Central Bedfordshire and not this council. And the sector names come from running each sale’s postcode through postcodes.io, so they are the actual wards and parishes those sales sit in, not a guess from the map.
| Sector | Mainly | Median | Sales |
|---|---|---|---|
| MK44 2 | Ravensden, Thurleigh, Colmworth, Bolnhurst and Keysoe | £542,475 | 48 |
| MK43 8 | Bromham and Turvey | £440,000 | 81 |
| MK44 3 | Great Barford, Willington, Roxton and Cople | £408,500 | 66 |
| MK44 1 | Sharnbrook, Riseley, Milton Ernest and Bletsoe | £400,000 | 56 |
| MK45 3 | Wilstead, Cotton End and the Bedford edge of Houghton Conquest | £400,000 | 54 |
| MK43 9 | Wootton and Stewartby | £373,750 | 132 |
| MK41 8 | Putnoe and the north end of Brickhill | £370,250 | 79 |
| MK41 9 | Goldington and the De Parys edge | £368,000 | 77 |
| MK43 7 | Harrold, Oakley, Felmersham, Stevington and Carlton | £355,000 | 67 |
| MK42 6 | Wixams | £350,000 | 130 |
| MK40 4 | Biddenham, Queens Park and Great Denham | £348,000 | 201 |
| MK41 7 | Brickhill | £342,500 | 136 |
| MK40 3 | Castle, Newnham and De Parys | £340,000 | 128 |
| MK41 0 | Renhold, Riverfield and east Goldington | £325,000 | 85 |
| MK42 7 | Kempston West and Kempston South | £312,500 | 117 |
| MK41 6 | Clapham | £295,000 | 55 |
| MK42 8 | Kempston Central, East and North | £290,000 | 112 |
| MK42 0 | Kingsbrook and Shortstown | £290,000 | 142 |
| MK42 9 | Cauldwell and Elstow | £260,000 | 127 |
| MK40 2 | Harpur and the west side of the town centre | £193,750 | 78 |
| MK40 1 | Greyfriars and the town centre core | £185,000 | 34 |
Sectors with fewer than 20 sales in the window are left out, along with the handful of PE, NN and LU postcodes that clip the borough boundary.
The town centre is a flat market, and it prices like one
MK40 1 and MK40 2 look startling in that table until you look at what actually sold there. Across the two sectors, 78 of the 112 sales were flats or maisonettes, which is 70% against 12.8% borough-wide. The combined median for the two sectors was £191,250, and the flat median was £161,000 in MK40 1 and £167,500 in MK40 2.
That is not a distressed market. It is a different product. If you want a house near the town centre, the nearest sectors that sell houses in volume are MK40 3 (Castle, Newnham and De Parys) at £340,000 and MK40 4 (Queens Park, Biddenham and Great Denham) at £348,000, and both are a short walk from the Embankment.
The cheapest streets in the borough by median are all town-centre flat conversions and blocks: Linden Road at £105,000 across eight sales, all of them flats, then Shakespeare Road at £150,000, Crowe Road at £155,500 and Warwick Avenue at £157,000. Before you read those as bargains, check the tenure and the service charge, because in this part of Bedford they are what separate two otherwise identical asking prices.
The expensive half: the villages and Kimbolton Road
The money in Bedford borough is not in the town. It is north and west of it.
MK44 2 was the most expensive sector at a £542,475 median across 48 sales, covering Ravensden, Thurleigh, Colmworth, Bolnhurst and Keysoe. Twenty-nine of those 48 sales were detached houses, at a median of £660,000. Bromham and Turvey (MK43 8) followed at £440,000, with a detached median of £582,500, and the Harrold, Oakley and Felmersham sector (MK43 7) had the borough’s highest detached median of all at £670,000.
Inside the built-up area, the standout is Kimbolton Road. The MK41 stretch, running north from De Parys past Putnoe, recorded 11 sales at a median of £825,000, ten of them detached. Nothing else in the borough with a meaningful number of sales comes close. Deep Spinney in Biddenham managed £427,500 across eight, and the MK44 High Streets, taken together, £495,000 across 21.
The single largest sale in the year was £2.3 million on Manor Road in the MK43 9 sector, which covers Wootton and Stewartby.
New build, Wixams and what it does to the numbers
Ninety-six of the year’s sales were new builds, at a median of £377,500 against £333,750 for existing homes. Most of that is one place. Rosemary Lane in Wixams alone accounted for 27 sales, all in the single postcode MK42 6GF, at a median of £269,637, and the Wixams sector as a whole recorded 130 sales at £350,000.
That matters if you are comparing Wixams to anywhere else. A new-build estate sells its whole first phase inside a year, so it appears in the data as a burst of near-identical prices rather than a normal spread of second-hand homes. The same effect will show up around Shortstown and the former DVSA site as those planning permissions build out.
How to check a specific street
Everything above is derived from data anyone can query.
- For the borough average and the trend, use the UK House Price Index for Bedford. It is monthly, free and built from completed sales.
- For individual sold prices, use the Land Registry’s Price Paid search. You can filter by postcode and date and see the actual figure on the actual house.
- Remember that Price Paid records the price at completion, which is typically two to three months after the offer was accepted. In a market moving 4.4% a year, that lag is worth about £1,200 a month.
If you are working out what a home costs to run rather than to buy, the annual rail season ticket is the number most Bedford buyers underestimate, and what gets built near you is set out in our Bedford planning page.
Sources
- UK House Price Index, Bedford, June 2026 (HM Land Registry linked data)
- UK House Price Index, England, June 2026
- UK House Price Index, East of England, June 2026
- HM Land Registry Price Paid data, 2,038 residential sales in the Bedford district completing 1 July 2025 to 30 June 2026, queried through the Land Registry SPARQL endpoint
- postcodes.io, for the ward and parish behind each postcode sector
Have your say