
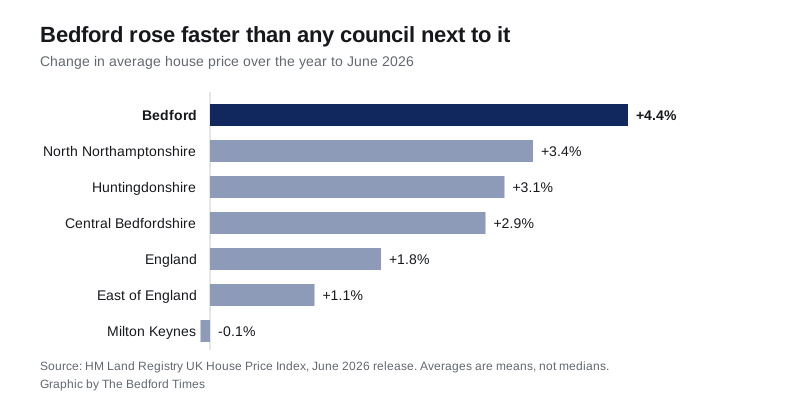
The borough average is £329,830, up 4.4% against England's 1.8%. But May's £334,156 was an all-time record, and June gave £4,326 of it straight back.
The average Bedford home is worth £13,849 more than it was a year ago. That is a rise of 4.4%, and it is faster than any of the four councils that border the borough.
The figures come from HM Land Registry’s UK House Price Index for June 2026, published this month. One thing to hold on to before the numbers: the index average is a mean, not a median. A handful of very large sales pull it upwards, so it sits above what a typical Bedford home changes hands for.
Bedford against its neighbours
Every figure below is from the same June 2026 release, so the comparison is like for like.
| Area | Average price | Change over the year |
|---|---|---|
| Bedford | £329,830 | +4.4% |
| North Northamptonshire | £256,610 | +3.4% |
| Huntingdonshire | £306,387 | +3.1% |
| Central Bedfordshire | £356,453 | +2.9% |
| Milton Keynes | £325,104 | -0.1% |
| East of England | £338,707 | +1.1% |
| England | £293,262 | +1.8% |
Bedford grew at nearly two and a half times the England rate and four times the East of England rate. Milton Keynes, next door, went backwards.
It is worth being honest about how far that goes nationally. Bedford is not booming by English standards. Ninety-three of England’s 295 local authority districts grew faster over the same twelve months, and Bedford’s average price ranks 120th of the 295. What the borough is doing is beating a weak national market and a weaker regional one, with 62 districts falling outright.
The record, and the month it slipped
May 2026 was the highest month the index has ever recorded for Bedford, at £334,156. June came in at £329,830. That is £4,326 off in a single month, a fall of 1.3%.
Only 17 English districts fell faster in June, and two matched Bedford exactly. It is the borough’s second monthly fall of 2026, after a 1.5% drop in January, and the two are the steepest since April 2024.
A single month is not a trend, and the most recent month of the index is always the one most likely to be revised. The twelve-month picture is the more reliable one, and it is still firmly positive.
Flats are the exception, and it is not close
Split the market by property type and one part of it has simply not come back.
| Type | June 2026 | Change over the year |
|---|---|---|
| Detached | £560,990 | +3.6% |
| Semi-detached | £346,527 | +5.3% |
| Terraced | £275,742 | +5.4% |
| Flat or maisonette | £159,325 | +2.0% |
Detached, semi-detached and terraced houses all set their own records in May 2026 and eased back in June. Flats did not. The flat average peaked in November 2022 at £162,893 and is still £3,568 short of it three and a half years later.
Go back to January 2023 and the comparison is starker still. The borough average then was £314,176 and the flat average was £159,577. Since then the borough average has gained £15,654. The flat average has lost £252.
That matters well beyond people who own one. Flats are the cheapest way into the Bedford market, and the entry point has not moved while everything above it has. The average first-time buyer purchase in the borough was £271,873 in June, up 4.8% over the year.
How many homes are actually selling
The index publishes sale counts a few months behind the prices, so the most recent complete month is April 2026, at 119 sales.
The comparison people reach for, April 2025, is useless, and it is worth explaining why. The stamp duty thresholds changed on 1 April 2025, so completions were dragged forward into March.
- March 2025: 394 sales
- April 2025: 107 sales
- March 2026: 133 sales
- April 2026: 119 sales
Across whole years the picture is much calmer. Bedford borough recorded 2,363 registered sales in 2024 and 2,483 in 2025.
A correction to our own figure
The Land Registry keeps adding completed sales to a month after it first publishes it, so first releases are provisional.
May 2026 was first published at £332,893, an annual rise of 6.7%. The June release revises it up by £1,263, to £334,156 and 7.1%. Our Bedford house prices page was written from the first figure and has been updated.
What it means for you
If you are selling, the year has been on your side, but the month was not. Anything priced against a May comparable is priced against the highest point the index has ever recorded for this borough.
If you are buying a flat, you are the only buyer in Bedford looking at a market that has gone nowhere in three and a half years. Whether that reads as value or as a warning depends on why it has not moved, and the index does not answer that.
If you are buying a house, the middle of the market is where the growth is. Terraces and semis rose faster over the year than detached homes did.
Whatever you are doing, the index is a borough-wide mean covering everywhere from Podington to Wixams. Our Bedford house prices page carries median sold prices by postcode sector, which is the closer guide to a particular street. The other number that moves Bedford prices is the commute, and our Bedford train times to London page has the current journey times and fares.
Update, 25 September 2026: the July release revised the figures above. June 2026 is now £331,319, up 4.9% on a year earlier, rather than £329,830 and 4.4%. May 2026 is now £335,169, up 7.5%, rather than £334,156 and 7.1%. The June fall is now £3,850, or 1.1%. Our July house prices story has the latest figures.
Have your say