
The borough average reached £333,824 in July, up 3.9% and still ahead of every neighbour. The annual rate was 7.5% in May, and flats barely moved.
The average Bedford home was worth £333,824 in July. That is £12,497 more than a year earlier, a rise of 3.9%.
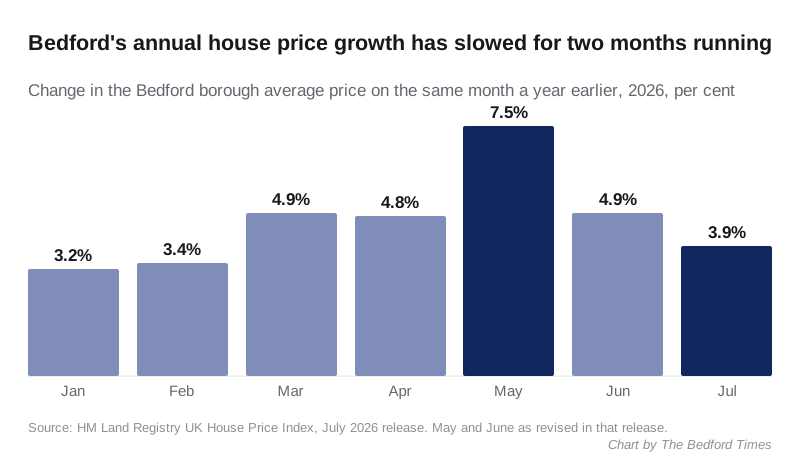
Bedford is still growing faster than any council that borders it. But the annual rate has now slowed for two months in a row, from 7.5% in May to 4.9% in June and 3.9% in July.
The figures come from HM Land Registry’s UK House Price Index for July 2026. The index average is a mean, not a median. A few very large sales pull it upwards, so it sits above what a typical Bedford home sells for.
Bedford against its neighbours
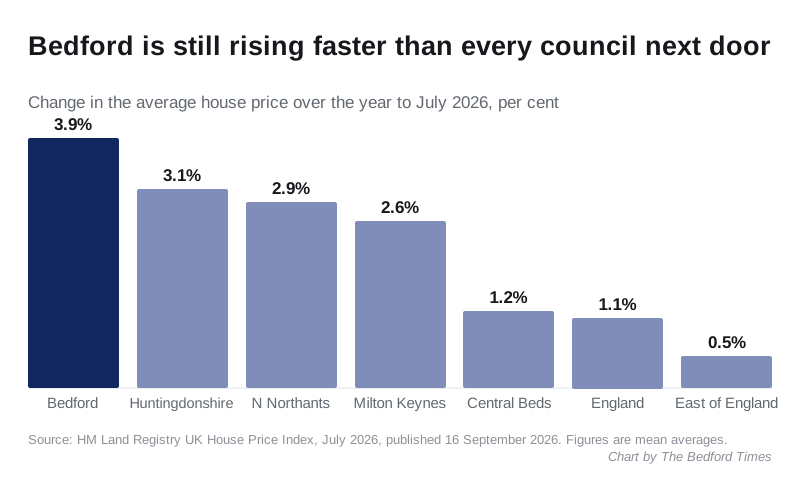
Every figure below is from the same July 2026 release, so the comparison is like for like.
| Area | Average price, July 2026 | Change over the year |
|---|---|---|
| Bedford | £333,824 | +3.9% |
| Huntingdonshire | £308,374 | +3.1% |
| North Northamptonshire | £257,807 | +2.9% |
| Milton Keynes | £330,419 | +2.6% |
| Central Bedfordshire | £356,758 | +1.2% |
| England | £293,479 | +1.1% |
| East of England | £337,518 | +0.5% |
Bedford’s annual rise is more than three times England’s and nearly eight times the East of England’s. Central Bedfordshire is still the dearer place to buy, by £22,934 on average, but its prices grew at under a third of Bedford’s pace.
Why the annual rate is falling
Month to month, July was a good one. The average rose 0.8%, or £2,505, from June’s £331,319. It is now the second highest figure the index has recorded for the borough, £1,345 below May’s record of £335,169.
The slowdown is mostly about last year, not this one. Bedford prices jumped in the summer of 2025:
- June 2025: up 1.3% in the month
- July 2025: up 1.7%
- August 2025: up 1.6%
Each of those months is now the comparison point. The higher the base, the smaller the annual rise looks, even when prices are still climbing.
August is the next hard test. The August 2025 average was £326,332. To hold a 3.9% annual rise, August 2026 would need to come in at about £339,000. That is higher than any month on record.
Houses up, flats still stuck
Split by property type, every kind of house rose by between 3.5% and 4.9%. Flats rose 0.8%.
| Type | July 2026 | Change over the year |
|---|---|---|
| Detached | £567,193 | +3.5% |
| Semi-detached | £351,158 | +4.9% |
| Terraced | £279,834 | +4.7% |
| Flat or maisonette | £160,624 | +0.8% |
The Bedford flat average peaked in November 2022 at £162,893. It is still £2,269 below that, more than three and a half years on.
Bedford flats are at least still rising. Across England the average flat is down 3.5% on a year ago, and across the East of England it is down 2.5%.
The average first-time buyer paid £275,319 in July, up 4.2% over the year.
Last month’s figures have moved
The Land Registry keeps adding sales to a month after it first publishes it, so recent figures are provisional. This release revised both of the previous two months upwards:
- June 2026 was first published at £329,830, up 4.4%. It is now £331,319, up 4.9%.
- May 2026 was £334,156, up 7.1%, in the June release. It is now £335,169, up 7.5%.
Our June house prices story carries a dated note with the revised figures. Expect July to move again next month.
What it means for you
If you are selling, prices are still going up. A July comparable is now close to the record set in May, so there is little sign of the market going backwards.
If you are buying a house, semis and terraces are where prices are rising fastest, at 4.9% and 4.7% over the year.
If you are buying a flat, you are looking at a market that has gone almost nowhere since late 2022, while the houses above it have moved on.
Whatever you are doing, this is a borough-wide average covering everywhere from Podington to Wixams. Our Bedford house prices page has median sold prices by postcode sector, which is a closer guide to a particular street.
Sources
- UK House Price Index, Bedford, July 2025 to July 2026, HM Land Registry
- UK House Price Index data for each area and month, HM Land Registry
Have your say